

The 2025 calendar year delivered exceptional performance across the precious metalscomplex, reinforcing their role as critical components of a diversified portfolio in a volatile macroeconomic environment.
The annual returns from key ASX listed ETF products highlight the scale of this rally:
- Global X Physical Silver Structured (ETPMAG.ASX): Achieved an annual return of 130.1%, driven by a combination of industrial supply deficits and increased investment demand.
- Global X Physical Platinum Structured (ETPMPT.ASX): Delivered a robust 104.9% return, benefiting from its dual role as both an industrial catalyst and a store of value.
- Global X Physical Gold Structured (GOLD.ASX): Posted a stellar 52.6% return, supported by significant central bank accumulation and a structural pivot in global interest rate expectations.
Source:GlobalX
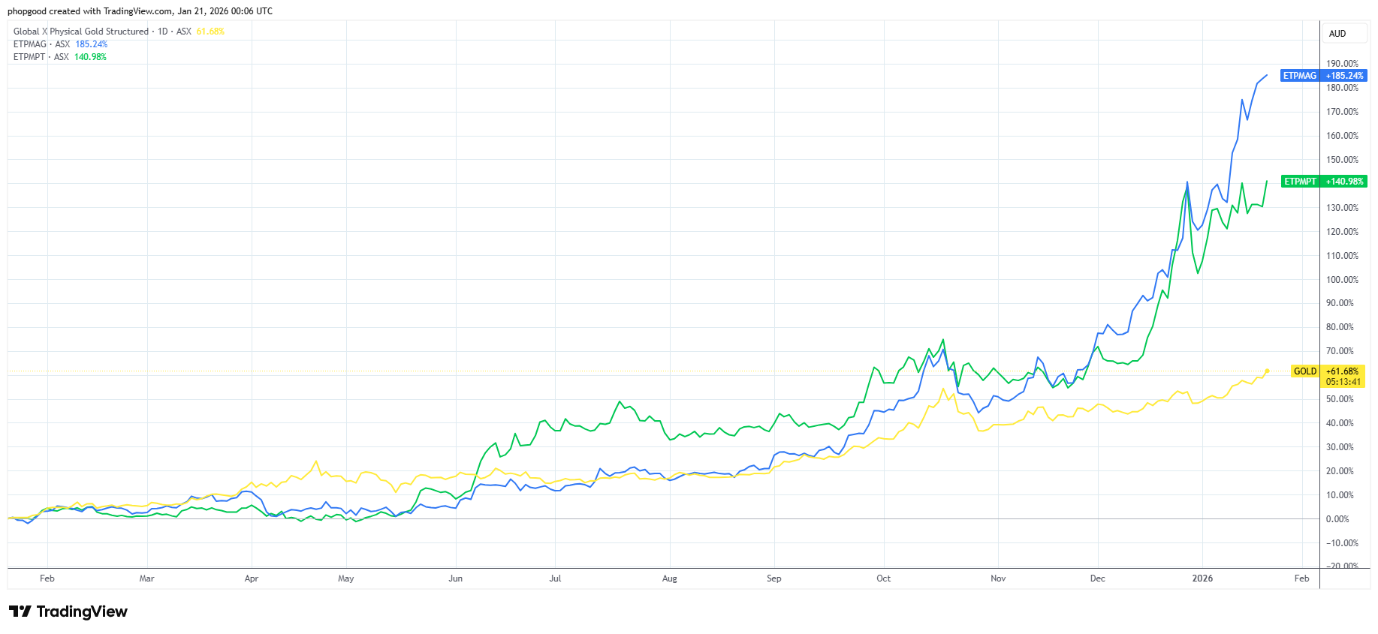
The rally into 2026 has intensified. Gold is often the focus of headlines and hashad a stellar run, however silver has been the real MVP recently. Year to date,gold has returned 61.7%, while silver is up over 185%. This has been driven bya perfect storm of industrial demand, speculative frenzy and a normalisation ofthe Gold/Silver Ratio.
While these figures are historic, they serve as the foundation for the structural shifts we are witnessing as we move into 2026. This post explores the fundamental drivers for the rally, including central banks buying gold and where big banks see the price heading, and the accelerating silver squeeze.
CentralBank Demand: A Structural Shift in Reserve Management
One of the most profound drivers of the current gold price is the sustained, strategic accumulation of the metal by global central banks. The official sector has moved beyond tactical buying into a long-term structural trend ofdiversification away from US dollar-denominated assets.
According to J.P. Morgan Global Research, central bank demand is projected to average approximately 190 tonnes per quarter throughout 2026. This consistent "official bid" provides a formidable floor for prices, effectively decoupling gold from its traditional inverse correlation with real interest rates. In an era of heightened geopolitical risk and sovereign debt concerns, gold’s status as a neutral, tier-one reserve asset has never been more relevant.
A structural shift in global reserve management is accelerating, with central bank gold holdings now accounting for nearly 20% of official reserves. This trend is driven by a deliberate diversification away from USD-denominated assets, particularly among emerging market central banks seeking to mitigate foreign exchange risk. Even at elevated price points of US$4,000 to US$5,000per ounce, the "notional shift" required for laggard nations to reach a modest 10% gold-to-reserve allocation would trigger between 1,200 and 2,600 tonnes of additional demand. This consistent buying provides a formidable long-term floor for the metal.
Parallel to central bank activity, private investor appetite is evolving from a cyclical hedge into a structural allocation. While gold’s share of total assets under management (AUM) has risen to 2.8%, analysts see a clear path toward a 4–5% weighting as the Federal Reserve’s easing cycle increases the appeal of non-yielding assets. With J.P. Morgan forecasting robust inflows into ETFs and physical bars alongside an inelastic mine supply, the market remains tightly coiled. Should even a fractional 0.5% of foreign-held U.S. assets rotate into gold, the resulting demand could realistically drive prices toward a multi-yeartarget of $6,000/oz.
(Source:J.P.Morgan)
2026 Institutional Price Targets
So,where to from here? The institutional consensus for 2026 is undeniably positive. The big banks have upgraded their end of year price forecasts. From today’s gold and silver prices of US$4,784/oz and US$95/oz respectively, here’s a summary of where the major players see prices heading by the end of this year.
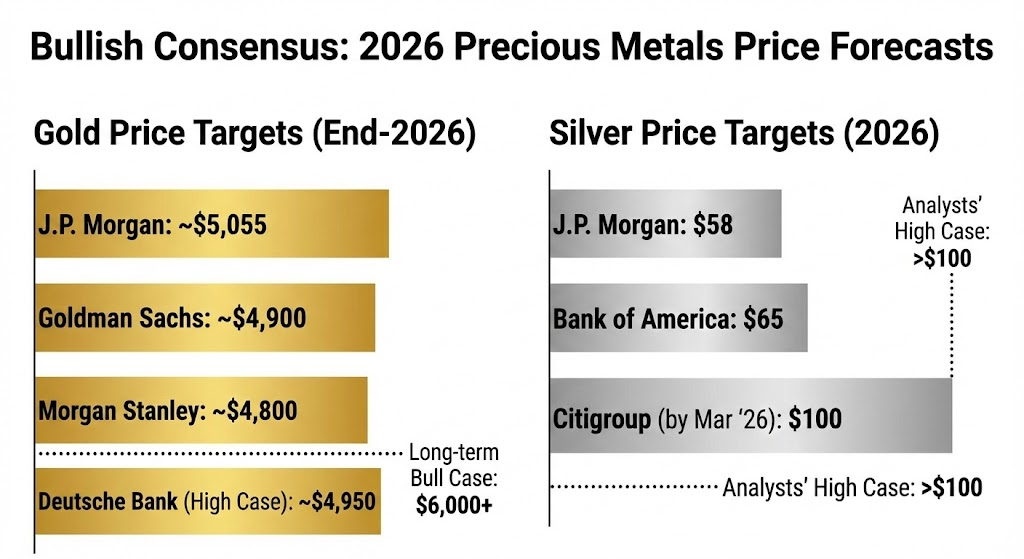
Conviction remains high across major research houses for the year ahead. Analysts are largely clustering around a $5,000/oz target for gold, with silver targets exhibiting a wider, more volatile range.
The Silver Industrial Squeeze
While gold often captures the headlines, silver’s performance in 2025 was the resultof a severe and compounding supply-demand imbalance. Silver is experiencing physical deficits, policy-driven supply restrictions, and concentrated inventories. Silver is part monetary metal, part industrial commodity. The explosive move in silver is largely being driven by the latter. Industrial consumption now accounts for over 50% of total silver demand, supercharged by:
- Photovoltaics (Solar): Increasing efficiency requirements are driving higher silver loading in next-generation cells.
- Artificial Intelligence Infrastructure: AI data centers require exponentially more electrical capacity and high-conductivity components than traditional computing.
- Electric Vehicles: EV production scaling continues to pull significant tonnage for power electronics and battery components.
With primary mine supply remaining inelastic (silver is largely a by-product of basemetal mining) the physical tightness in the market remains a primary catalyst for price discovery. Combined with retail investors piling back into ETFs, this has created the rocket fuel for the price action we're seeing.
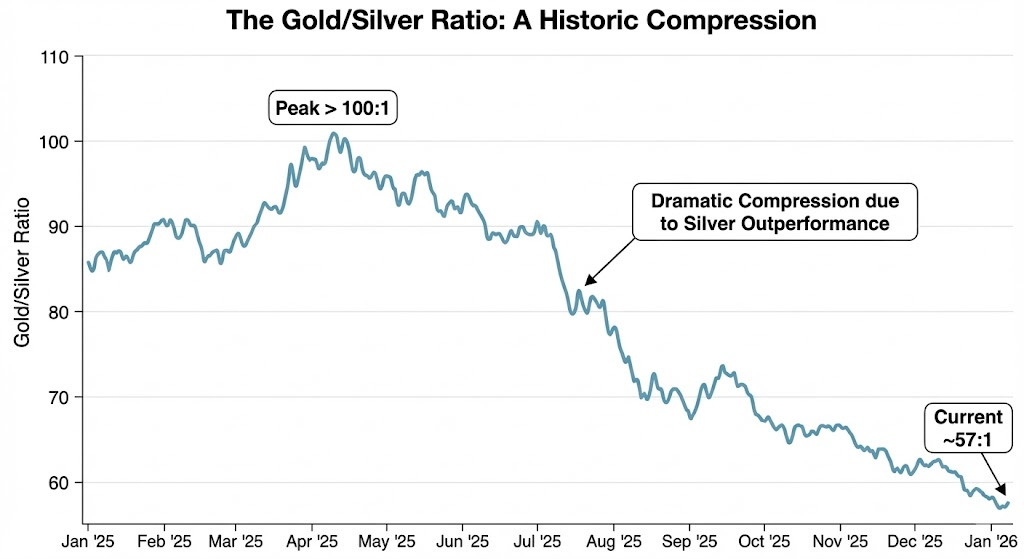
TheGold/Silver Ratio: A Signal Flashing Red
The Gold/Silver Ratio (which indicates how many ounces of silver are required to purchase one ounce of gold) remains a vital tactical indicator for silver. The ratio typically ranges between 50:1 and 70:1, a ratio exceeding 80:1 generally signals that silver is significantly undervalued relative togold. After breaching the 100:1 level in early 2025, we saw a rapid compressionto below 60:1 by January 2026 as silver rallied.
The dramatic compression shows just how hard silver has run, and puts theGold/Silver Ratio back to the long term average. Silver is not at the screaming buy levels it was a year ago, however it may have further to run due to the supply issues and industrial supply crunch.
Investment Outlook
For Australian investors, the investment case for precious metals has transitioned from a defensive "safe haven" play to a strategic "alpha" source. Whether through direct bullion, physical ETFs, or the gold-mining sector (which enjoys high margins at current A$ spot prices), exposure to this complex remains a prudent hedge against the "debasement trade" and ongoing geopolitical fragmentation.
While the upside in silver may be limited given the current Gold/Silver Ratio, ongoing central bank and retail demand, combined with supply constraints present a competing case to continue holding gold.
This article contains general information only and does not take into account your personal objectives, financial situation or needs. It should not be relied upon as financial or investment advice. Before making any financial decisions, you should consider whether the information is appropriate to your circumstances and seek professional advice. Past performance is not a reliable indicator of future results, and the value of investments can rise and fall. Paul Hopgood and P3 Financial Planning do not accept liability for any loss arising from the use of, or reliance on, the information contained in this publication.